

In the ever-evolving and fast-paced world of trading, having a clear strategy is not just important; it’s essential for success. One of the most effective methods to gain a comprehensive understanding of the market is through top down analysis. This technique, which involves combining multiple time frames, offers a more informed and holistic view of market conditions, helping traders make better decisions. In this detailed guide, we will explore how to integrate price action with smart money concepts to achieve clearer and more precise chart analysis using top-down market analysis.
Understanding Top Down Analysis
Top-down analysis is a systematic approach that starts with higher time frames and progressively zooms in to lower time frames. This method helps traders get a grasp of the overall market direction, identify critical levels of support and resistance, and uncover potential trading opportunities that may not be visible on a single time frame. The strength of top-down market analysis lies in its ability to provide a broader perspective, ensuring that traders don’t miss significant trends or levels.
The Basics of Top Down Analysis
The essence of top-down analysis is to gain a comprehensive view of the market by examining different time frames. The process begins with the highest available time frame and then moves to progressively lower time frames. This approach helps in:
- Identifying Major Trends: Higher time frames like the weekly or daily charts provide insights into long-term trends and significant market levels.
- Recognizing Key Levels: Key levels of support and resistance are often more apparent on higher time frames, guiding future trading decisions.
- Refining Trade Setups: Lower time frames help in fine-tuning entry and exit points, making trades more precise and effective.
By starting with higher time frames and moving to lower ones, traders can avoid the pitfalls of relying solely on a single time frame, which can often be misleading due to its limited perspective.
Why Should You Combine Multiple Time Frames?
Relying on a single time frame can be risky and often leads to incomplete analysis. A 15-minute chart might show a bullish trend, but without considering higher time frames, you could overlook critical resistance levels that might reverse the trend. Here are three key reasons why combining multiple time frames is crucial for effective chart analysis:
1. Overcoming Directional Confusion
Directional confusion often arises when analyzing lower time frames, where the market may appear choppy or indecisive. For instance, a 5-minute chart of GBP/USD might seem erratic, making it difficult to discern a clear trend. However, by zooming out to a 1-hour chart, the broader market direction becomes clearer. This broader view helps in understanding the overall trend and making more informed trading decisions. Top-down analysis is instrumental in overcoming this confusion by providing a clearer picture of the market’s direction.
2. Increasing Trade Accuracy
Accuracy in trading is not just about identifying profitable trades but also about avoiding unnecessary losses. A promising move on a lower time frame might turn out to be a trap if not considered within the context of higher time frames. For example, a bullish move on a 15-minute chart might seem like an excellent opportunity to go long. Yet, if a significant resistance level on a higher time frame is ignored, the market might reverse unexpectedly. By incorporating higher time frames into your analysis, you can set more realistic targets and improve trade accuracy.
3. Optimizing Trade Entries and Exits
Timing is crucial in trading. Entering a trade too early or too late can significantly impact profitability. Analyzing multiple time frames helps optimize entry and exit points. For instance, if you’re waiting for a pullback to an order flow area on a higher time frame, lower time frames can help you enter at a more favorable price. This approach reduces the likelihood of false signals and enhances confidence in the trade. Additionally, it allows for more precise stop-loss levels, improving overall risk management.
The Process of Top Down Analysis: A Step-by-Step Guide
To effectively perform top-down analysis, follow these steps, starting from higher time frames and working your way down:
1. Higher Time Frames (Weekly and Daily Charts)
Analyzing Weekly and Daily Charts
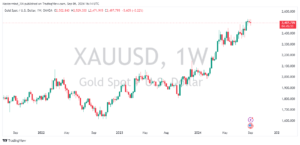
Begin by examining the weekly and daily charts to get a macro view of the market. These charts provide insights into long-term trends, key levels of support and resistance, and significant market structures. Here’s how to approach this step:
- Identify Major Trends: Look for the overarching trend on the weekly chart. Is the market in an uptrend, downtrend, or range-bound? This trend will guide your analysis on lower time frames.
- Mark Key Levels: Identify and mark significant levels of support and resistance that have been respected over time. These levels are crucial as they often act as barriers for future price movements.
- Note Major Events: Be aware of major economic or geopolitical events that could influence the market. These events are often reflected on higher time frames.
Diagram: Weekly Chart Analysis
2. Mid-Level Time Frames (4-Hour and 1-Hour Charts)
Analyzing 4-Hour and 1-Hour Charts
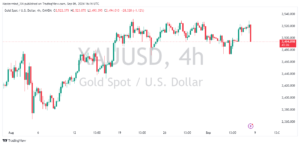
Once you have a clear understanding of the higher time frames, zoom into the 4-hour and 1-hour charts. This is where you’ll conduct the bulk of your analysis, focusing on more detailed market movements. Here’s what to do:
- Assess Market Direction: Verify the market direction identified on the higher time frames. This confirmation helps in aligning your analysis with the broader trend.
- Identify Supply and Demand Zones: Look for areas where price has previously experienced strong buying or selling. These zones can indicate potential reversal points.
- Spot Order Blocks and Liquidity Zones: Identify areas where institutional traders have likely placed large orders. These zones can offer significant trading opportunities.
Diagram: 4-Hour Chart Analysis
3. Lower Time Frames (15-Minute and 5-Minute Charts)
Analyzing 15-Minute and 5-Minute Charts
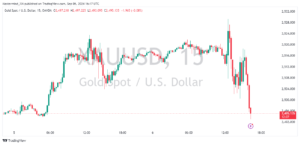
Finally, use the 15-minute and 5-minute charts to refine your trade entries and exits. This is where precision becomes crucial:
- Look for Confirmation: Wait for confirmation of the signals observed on higher time frames. This could be a price pattern, a change in character, or a break of structure.
- Fine-Tune Entries and Exits: Use these lower time frames to pinpoint optimal entry and exit points. Look for specific price patterns or setups that align with your higher time frame analysis.
- Set Realistic Targets: Based on your lower time frame analysis, set realistic profit targets and stop-loss levels. This ensures a favorable risk-to-reward ratio.
Diagram: 15-Minute Chart Analysis
Practical Application: EUR/USD Case Study
To demonstrate top-down analysis in action, let’s walk through a detailed example using the EUR/USD pair.
Step 1: Analyze the Weekly Time Frame
Start by examining the weekly chart to identify major market levels and trends. For instance, suppose the weekly chart shows a long-term uptrend with significant support at 1.1500 and resistance at 1.2000. These levels are crucial as they represent key areas where price has historically reacted.
Step 2: Zoom into the Daily Time Frame
Move to the daily chart to refine your analysis. Adjust the weekly levels to align with daily price action. For example, you might notice that the price is approaching a daily resistance level at 1.1800, which coincides with a previous high. Mark this level as a key point for potential reversal or breakout.
Step 3: Analyze the 4-Hour Time Frame
On the 4-hour chart, apply smart money concepts to identify supply and demand zones. If the price has recently broken below a key support level with strong momentum, this indicates a bearish bias. Look for additional patterns or order blocks that support this bias.
Step 4: Confirm on the 1-Hour Time Frame
Use the 1-hour chart to look for confirmation of the bearish bias identified on the 4-hour chart. For instance, if you see a change in character or a break of structure that aligns with the bearish trend, it confirms your analysis. This is a good point to consider entering a short position.
Step 5: Fine-Tune on the 15-Minute Time Frame
Finally, use the 15-minute chart to fine-tune your entry and exit points. For example, wait for the price to enter a previously identified order block and look for a change in character to confirm the trend reversal. Set your entry at 1.1750, with a stop-loss at 1.1800 and a target at 1.1600.
The Importance of Backtesting Your Strategy
Before applying any trading strategy to a live account, it’s crucial to backtest it using historical data. Backtesting allows you to evaluate the performance of your strategy, identify strengths and weaknesses, and make necessary adjustments. It also helps build confidence in your approach by showing how it has performed under various market conditions.
One of the most efficient ways to backtest your strategy is by using a dedicated platform like Trader Edge. This tool allows you to simulate trades on historical data, track performance, and analyze key metrics such as win rate, maximum drawdown, and overall profitability. By backtesting, you can refine your approach, optimize parameters, and prepare for potential risks associated with your trading plan.
Read Also; How to Avoid Revenge Trading In Forex
Conclusion: The Power of Multi-Time Frame Analysis
Combining multiple time frames through top-down analysis is a powerful technique that can significantly enhance your trading performance. By understanding the broader perspective provided by higher time frames and drilling down into the finer details on lower time frames, you can make more informed decisions, reduce risk, and increase your chances of success.
Top-down analysis offers a structured approach to chart analysis, helping you identify key market levels, align with the overall market direction, and optimize trade entries and exits. Whether you’re dealing with directional confusion, aiming for more accurate trades, or fine-tuning your entry points, this technique provides the clarity and precision needed to navigate the markets effectively.
Leave a Reply